
The Scariest Debt Number of the Week - and Why the Fed Itself Disagrees
Two headlines came out of the same building this week. On Tuesday the New York Fed's Q2 household debt report showed credit card balances up $21 billion to $1.26 trillion, and the share of card debt more than 90 days past due at 12.8% - a number that instantly produced "worst since the Great Recession" takes. The same week, the New York Fed's own researchers published a post saying repayment behavior has been "largely stable since 2024." Neither side is lying. The trick is in what each number measures - and only one of them is about you.
What actually came out on August 11
The quarter itself was undramatic. Total household debt slipped $13 billion to $18.8 trillion. Mortgages fell $74 billion to $13.1 trillion, student loans eased $7 billion to $1.65 trillion; auto loans rose $28 billion to $1.71 trillion, HELOCs added $13 billion, and credit cards rebounded $21 billion after their usual first-quarter dip. Overall, 4.7% of outstanding debt was in some stage of delinquency - slightly better than the previous quarter.
The mood outside the data was worse than the data: the University of Michigan's preliminary August sentiment fell about 8% to 51.0, with year-ahead inflation expectations ticking up to 4.3%. Anxiety, in other words, is rising faster than debt is.
One word, two measurements
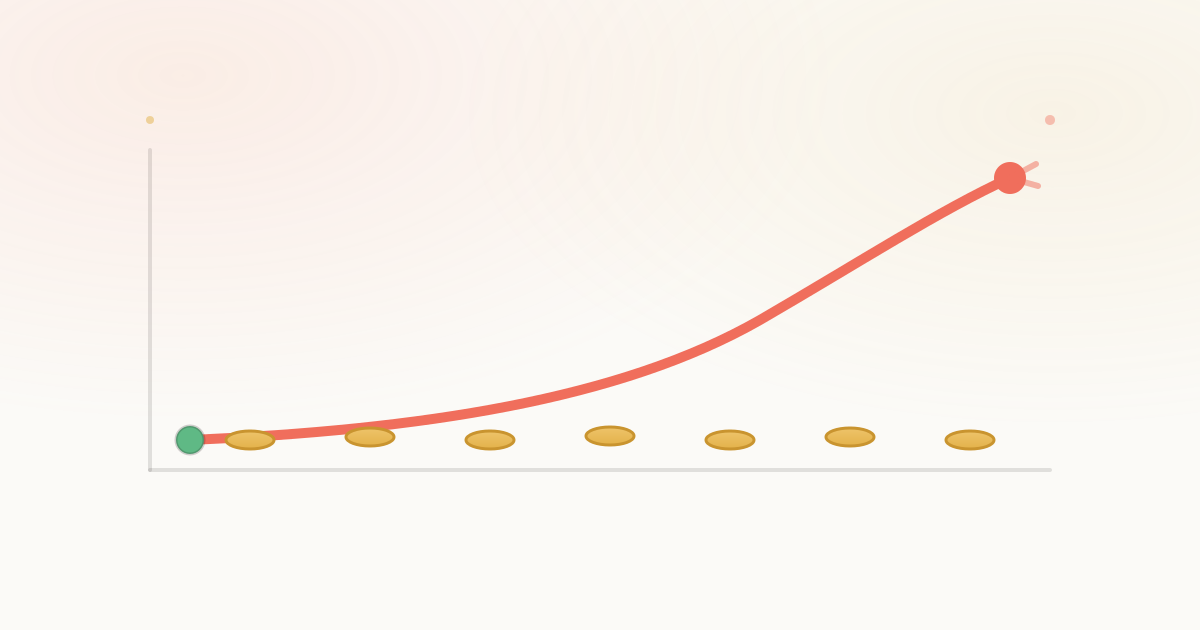
"Delinquency" hides two very different rulers. The scary one is the stock: out of all card balances still sitting on credit reports, what share is 90+ days late? That is the number that climbed from 7.6% in late 2022 to 12.8% by early 2026. The calm one is the flow: of the debt that was current, how much went seriously late this quarter? That number has barely moved in almost two years.
How can the warehouse fill up while the pipe stays steady? Because charged-off debt now lingers. The researchers - Donghoon Lee, Daniel Mangrum, Joelle Scally and colleagues - show that in 2004-2012 only about 40% of charged-off card debts were still being reported a year later; by 2024, about 80% were. Old defaults pile up in the statistics for years instead of vanishing. Strip those legacy balances out, and every delinquency measure tells the same quiet story: payment behavior has been roughly flat since 2024.
The scary number measures an archive of old defeats. Your money lives in the flow.
Which number is about you
A national stock rate cannot answer the only question that matters at your kitchen table. Your personal "stock" is whatever old debt is still hanging on your report. Your personal "flow" is what happened this month: did interest and minimum payments eat more of your income than last month? Did any bill slip past due that never used to? Is the balance trending down or up? Those three numbers are knowable in an evening - and until you know them, you are borrowing a national mood as a substitute for your own ledger. We wrote about that exact reflex in money dysmorphia.
Three honest caveats
- If you are inside the 12.8%, the mechanics are no comfort. A charged-off debt still exists, collectors still call, and the statistical explanation does not pay it. The divergence story is about reading national data, not about minimizing anyone's debt.
- "Stable" is not the same as "good." Nearly one dollar in twenty of household debt is late, early delinquencies on autos and mortgages ticked up, and card rates remain punishing. A steady flow at a painful level is still painful.
- None of the voices here is neutral. The Fed is explaining its own statistics, the press sells urgency, and this piece is written by a money app. All three of us have an angle; at least the numbers here are sourced.
One more number to disclose: ours
We make a money app, so this part comes with an obvious bias - only fair to say so upfront. You cannot audit a national statistic, but your personal flow takes one month of honest logging. Give debt its own category in SumiQ - interest, minimums, fees - and let recurring payments log themselves; the monthly total shows exactly what your debt costs you, and whether that cost is growing. That single number is calmer than any headline, in both directions.
And the card statistics do not even include installment plans - the four-payments-of-$22 kind that never feels like $88. That blind spot has its own piece: phantom debt. What an app honestly cannot do: pay the balance or lower your APR. It can only make sure nothing about your own money surprises you.
Bottom line
This week's scariest number measures a growing archive of old, already-written-off debt; the number that describes the living economy - and you - is the flow, and it has been steady. National statistics are useful context - but the numbers a life actually runs on are your own two or three. They fit on one screen.
Sources: NY Fed Liberty Street Economics · ABA Banking Journal · Yahoo Finance / Univ. of Michigan
Track spending by voice
Say "coffee 4 euros" - SumiQ logs, converts and categorizes it. Free for 7 days.
Download on the App Store